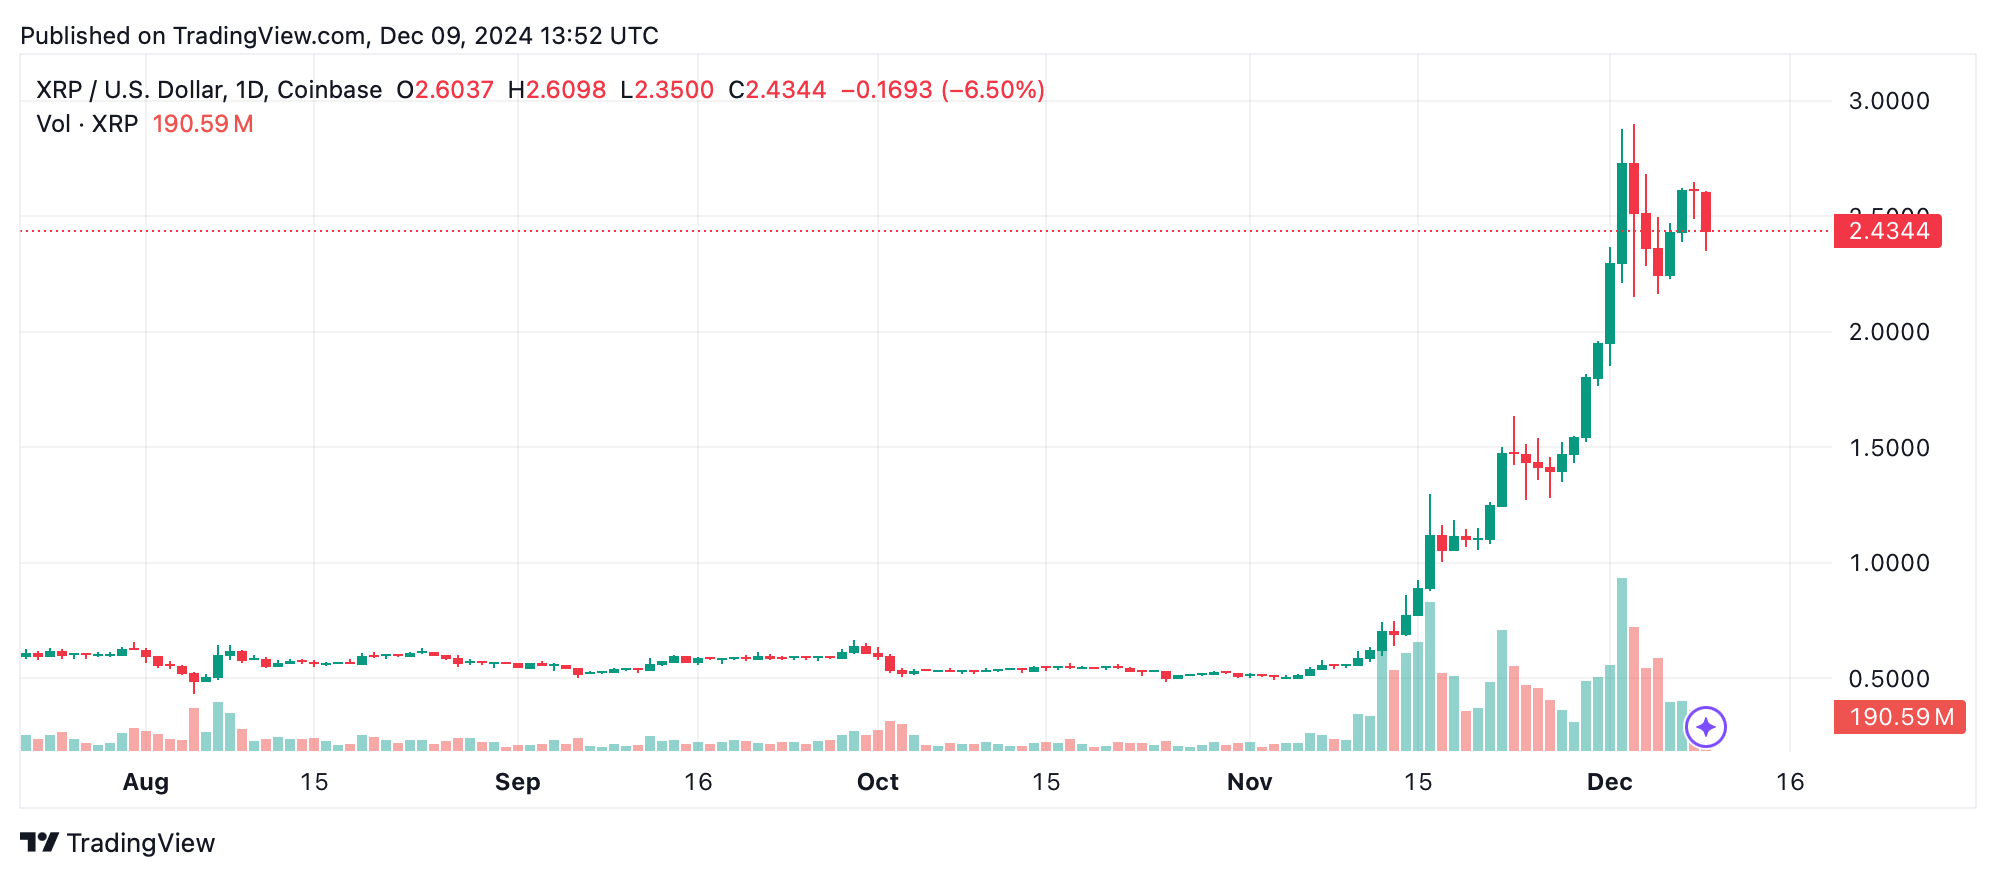
XRP has seen a notable 5% drop over the past day, trading at $2.42 as of now. Despite this decline, technical indicators suggest the potential for a bullish recovery, with key levels and patterns offering valuable insights for traders and investors. Could $2.91 be the catalyst for a rally to $3.50?
Key Technical Levels and Insights
Daily Chart: Bullish Momentum in Play
On the daily chart, XRP continues to exhibit a broader bullish trend, recently peaking at $2.91 before retracing to the $2.4 support level. This pullback represents a critical area of interest, supported by both psychological and technical factors.
Volume analysis reveals that trading activity has declined during this pullback, often a precursor to a resumption of the primary uptrend. Resistance remains at $2.91, and a breakout above this level could pave the way for significant upward movement, potentially targeting $3.5 or higher.

4-Hour Chart: Signs of Stabilization
The 4-hour chart reflects short-term bearish sentiment, characterized by lower highs since the $2.91 peak. However, XRP has managed to stabilize above the $2.4 support level, signaling the possibility of a reversal or consolidation phase.
Reduced volume during this consolidation suggests waning bearish momentum. A close above $2.65 on the 4-hour chart could reignite bullish momentum, with targets at $2.8 and a potential re-challenge of $2.91.
1-Hour Chart: Intraday Recovery Signals
For intraday traders, the 1-hour chart shows signs of recovery. After hitting a local low at $2.35, XRP formed a higher low at $2.4, indicating accumulating buying interest. Immediate resistance levels at $2.45 and $2.5 are critical for short-term gains.
Volume increases during green candles at the $2.4 level further bolster the case for a potential recovery. A confirmed breakout above these levels could see XRP targeting $2.65 and higher.
Technical Indicators Overview
Oscillators
The oscillators present a neutral outlook, consistent with the observed consolidation.
- RSI: Currently at 69.03, it signals a market nearing overbought territory but not yet poised for a reversal.
- MACD: Displays a buy signal, reinforcing the bullish framework.
- Momentum Indicator: Diverges slightly, indicating a sell, but this is offset by other bullish indicators.
Moving Averages
Moving averages strongly support the bullish case, with both exponential (EMA) and simple moving averages (SMA) signaling buy across multiple timeframes.
- Key Levels:
- 10-period EMA at $2.32 offers short-term support.
- 200-period SMA at $0.69 highlights robust long-term support.
Bullish and Bearish Scenarios
Bull Case
XRP’s ability to maintain the $2.4 support level, along with strong buy signals from moving averages, indicates bullish momentum. A breakout above $2.65 or $2.91 could lead to a rally toward $3.5, especially if accompanied by increased trading volume.
Bear Case
However, failure to overcome the $2.65 or $2.91 resistance levels may embolden bears. A drop below $2.35 could trigger a deeper retracement, potentially undermining the bullish outlook and bringing lower support levels into focus.
Conclusion
XRP stands at a critical juncture, with the $2.4 support level acting as a foundation for a potential rally. If bulls can break through key resistance levels, the path to $3.5 remains viable. However, traders should remain cautious of potential bearish scenarios, as failure to sustain upward momentum could lead to a significant pullback.
As the crypto market remains dynamic, XRP’s next moves will be crucial for determining its trajectory in the short and long term.

